Author: Arthur Berezin
Source: Planet OpenStack
Ceilometer Architecture
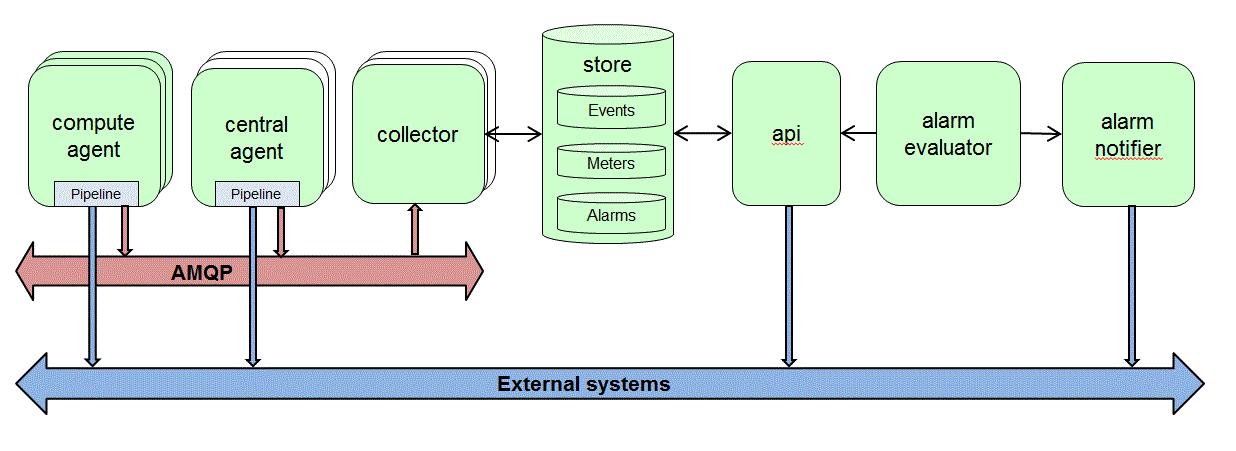
The following figure describes the main components of the Ceilometer sub-system.
Let’s briefly review the components from left to right. The compute agent runs on each compute node and polls statistics mainly via libvirt. The central agent runs centrally and polls statistics of the RESTful APIs of nova, glance, neutron and others. Both agents use a pipeline mechanism which is used for polling definitions, data manipulation and publishing. The publishing is done by notifications that are sent via the system message bus (AMQP) and other external APIs. The collector listens to the AMQP notifications sent by the agents and other OpenStack services and send these to the metering store. The store is simply a DB or a set of different DBs that provide flexible storing of events, meter and alarms using storage abstraction layer resides within the collector. An API server is running centrally and provides data access from the data store. The alarm-evaluator is polling the store and determines if a certain meter has reached a pre-configured threshold. Once alarm was declared or removed, the alarm-notifier will send an alarm notification to an external destination (e.g. webhook URL).
A better understanding of the concepts behind Ceilometer could be achieved by a deeper look into the pipeline mechanism. The pipeline is shown below:
Three type of meters are collected: Gauge, meaning a value of a measurement in a specific sample or duration; Delta, a change from the previous value and Comulativein which the sampled values are added during the time. A meter may undergo transformation in order to get a usable meaning. For example bytes per second counter may be transformed to Mbit/sec. Five Transformers are supported as follows:Accumulator which send several samples in one message; Aggregator which aggregates several sample values into a single value; Arithmetic that uses functions like * and / to provide percentage for example, Rate of change to identify trends andUnit conversion which has a self-explanatory meaning (e.g. Kbit to KByte).
Once a measurement (or a set) has been transformed it goes out via a multi publishermechanism. Several publishers are supported: Notifier – reliabale AMQP messaging,RPC – lossy AMQP, data over UDP and data sent into a File.
Scale up options were introduced lately for the central-agent to meet large scale deployments. Important to note that high-availablity (HA) for the collector is done via the regular RabitMQ/Pacemaker mechanism while the central and compute agents HA is provided using Zookeepr or Memcached.
Source: https://www.linkedin.com/pulse/dive-openstack-ceilometer-mishael-wexler
The post Ceilometer Architecture appeared first on Berezin’s Virtual Clouds.
Powered by WPeMatico