
Author: Doug Szumski
Source: Planet OpenStack
Monasca provides monitoring as a service for OpenStack. It’s scalable,
fault tolerant and supports multi-tenancy with Keystone integration.
You can bolt it on to your existing OpenStack distribution and it will
happily go about collecting logs and metrics, not just for your control
plane, but for tenant workloads too.
So how do you get started? Errr… well, one of the drawbacks of Monasca’s
microservice architecture is the complexity of deploying and managing the
services within it. Sound familiar? On the other hand this microservice
architecture is one of Monasca’s strengths. The deployment is flexible and
you can horizontally scale out components as your ingest rate increases.
But how do you do all of this?
Enter OpenStack Kolla.
Back in 2017, Steven Dake, the founder of the Kolla project, wrote
about
the significant human resource costs of running an OpenStack managed
cloud, and how the Kolla project offers a pathway to reduce them.
By providing robust deployment and upgrade mechanisms, Kolla helps
to keep OpenStack competitive with proprietary offerings, and at
StackHPC we want to bring the same improvements in operational
efficiency to the Monasca project. In doing so we’ve picked up the
baton for deploying Monasca with Kolla and we don’t expect to put
it down until the job is finished. Indeed, since Kolla already
provides many required services and support for deploying the APIs
has just been merged,
we’re hoping that this isn’t too long.
So what else is new in the world of Monasca? One of the key things that we
believe differentiates Monasca is support for multi-tenancy. By allowing a
single set of infrastructure to be used for monitoring both the control plane
and tenant workloads, operational efficiency is increased. Furthermore,
because the data is all in one place, it becomes easy to augment tenant
data with what are typically admin only metrics. We envisage a tenant
being able to log in and see something like this:
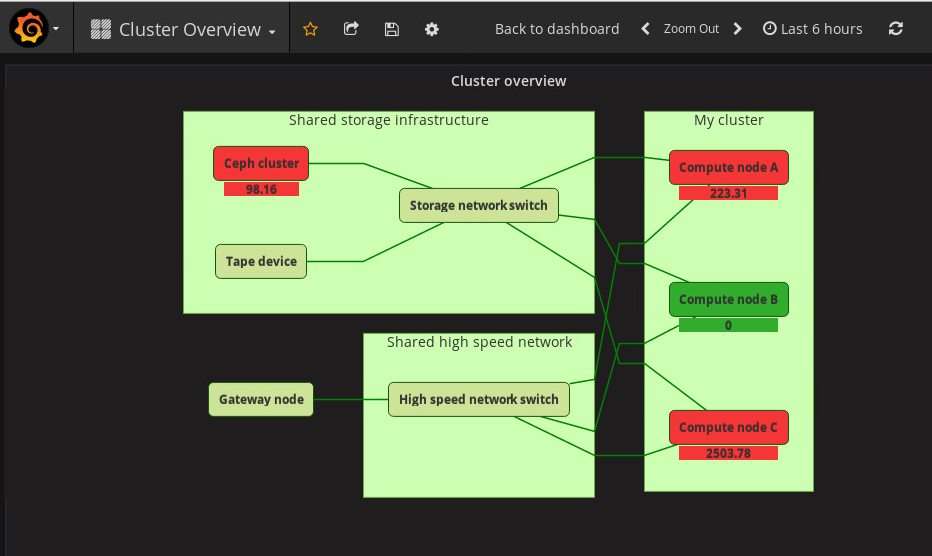
By providing a suitable medium for thought, the tenant
no longer has to sift through streams of data to understand that their job
was running slow because Ceph was heavily loaded, or the new intern had
saturated the external gateway. Of course, exposing such data needs to be
done carefully and we hope to expand more upon this in a later blog post.
So how else can we help tenants? A second area that we’ve been looking at is
logging. Providing a decent logging service which can quickly and
easily offer insight into the complex and distributed jobs that tenants run
can save them a lot of time. To this effect we’ve been adding
support for querying tenant logs via the Monasca Log API. After all
tenants can POST logs in, so why not support getting them out? One particular
use case that we’ve had is to monitor jobs orchestrated by
Docker Swarm. As part of
this work we knocked up a proof of concept Compose file
which deploys the Monasca Agent and Fluentd as global services
across the Swarm cluster. With
a local instance of Fluentd running the Monasca plugin, container stdout can
be streamed directly into Monasca by selecting the Fluentd Docker log driver.
The tenant can then go to Grafana and see both container metrics and logs
all in one place, and with proper tenant isolation. Of course, we don’t see
this as a replacement for Kibana, but it has its use cases.
Thirdly, a HPC blog post wouldn’t be complete without mentioning Slurm. As
part of our work to provide intuitive visualisations we’ve developed a
Monasca plugin
which integrates with the
Discrete plugin for
Grafana. By using the plugin to harvest Slurm job data we can present the
overall state of the Slurm cluster to anyone with access to see it:
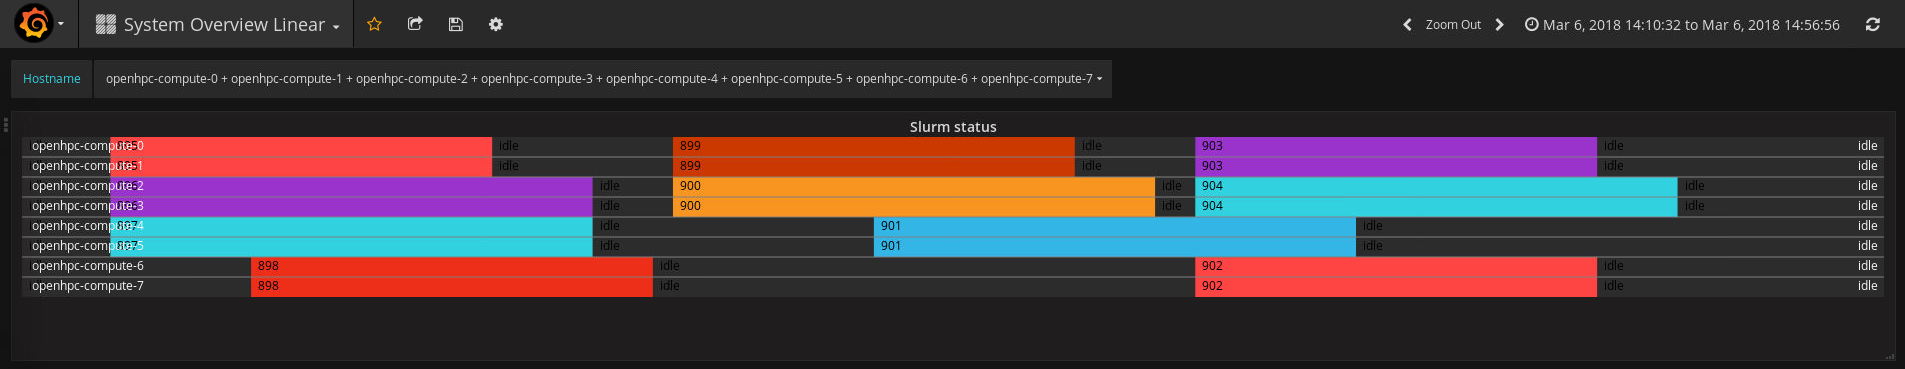
The coloured blocks map to Slurm jobs, and as a cluster admin I can
immediately see that there’s been a fair bit of activity. So as a user running
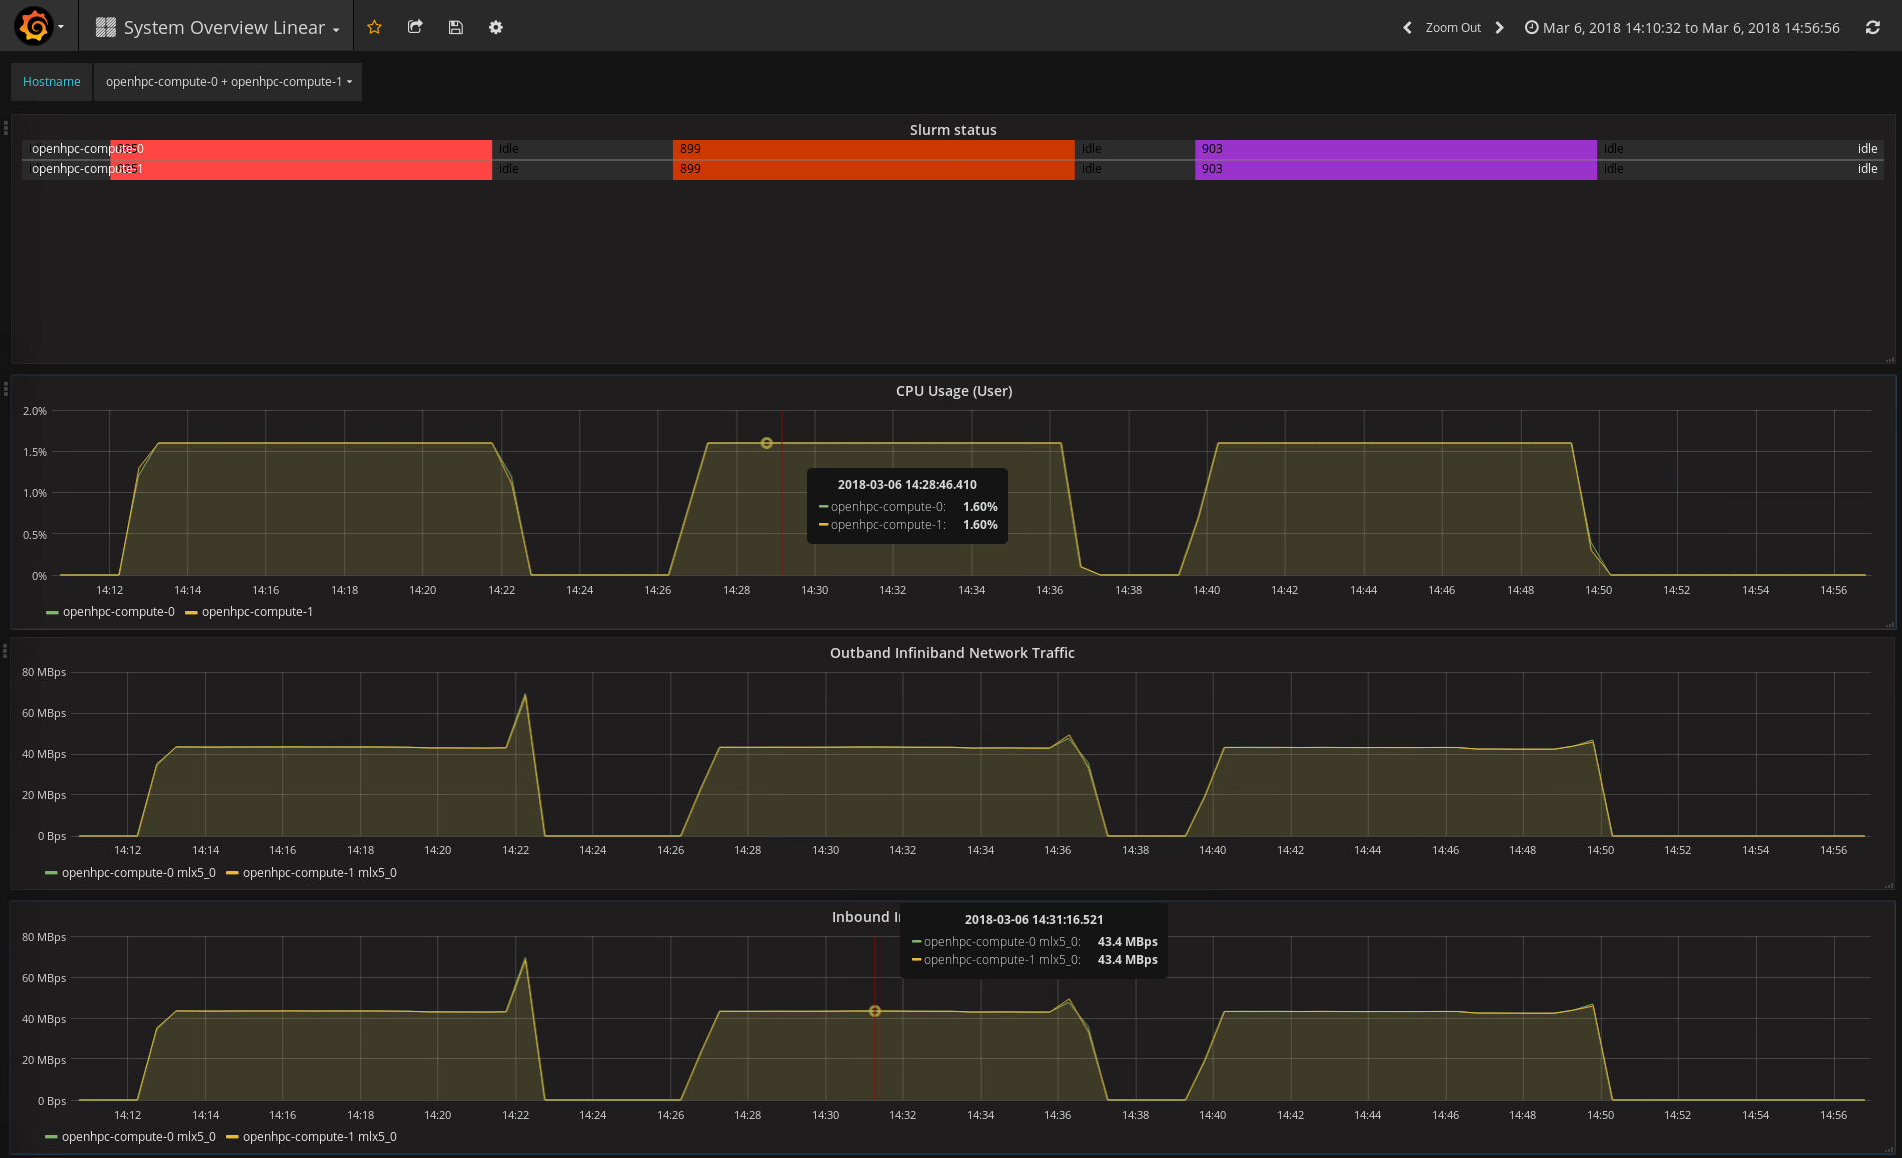
a Slurm job, can I easily get detailed information on the performance of my
job? It’s a little bit clunky at the moment, but this is something we want to
work on. Both on the scale of the visualisation; we’re talking thousands of
nodes not 8, and in the quality of the interface. As an example of what we
have today here’s the CPU usage and some Infiniband stats for 3 jobs running
on nodes 0 and 1:
Finally, we’ll finish up with a summary. We’ve talked about helping to drive
forward progress in areas such as deployment, data visualisation and logging
within the Monasca project. Indeed, we’re far from the only people
with a goal for bettering Monasca, and we’re very grateful for the others
that share it with us. However, we don’t want you to think that we’re living
in a bubble. In fact, speaking of driving, we see Monasca as an old car.
Not a bad one, rather a potential classic. One where you can still open the
bonnet and easily swap in and out parts. It’s true that there is a little
rust. The forked version of Grafana with Keystone integration prevents users
from getting their hands on shiny new Grafana features. The forked Kafka
client means that we can’t use the most recent version of Kafka, deployable
out of the box with Kolla. Similar issues exist with InfluxDB. And whilst the
rust is being repaired (and it is being repaired) newer, more tightly
integrated cars are coming out with long life servicing. One of these
is Prometheus, which compared to Monasca is exceptionally easy
to deploy and manage. But with tight integration comes less flexibility. One
size fits all doesn’t fit everyone. Prometheus doesn’t officially support
multi-tenancy, yet.
We look forward to exploring other monitoring and logging frameworks in
future blog posts.
Powered by WPeMatico